
Databricks Optimization Techniques to Improve Spark Performance.
If you’ve worked with Databricks for any length of time, you’ve probably seen this situation before. Two teams process almost the same amount of data. Both use Databricks. Both use Apache Spark. Both have access to similar cloud infrastructure. Yet one team’s workload finishes in fifteen minutes while the other takes more than two hours. The immediate assumption is usually that the slower team needs a bigger cluster. Sometimes that is true. More often, it is not. In many real-world projects, performance problems are caused not by a lack of computing power but by unnecessary work. Spark reads more data than required, moves excessive data across the network, manages thousands of small files, or performs expensive operations that could have been avoided. Understanding Databricks optimization techniques is therefore not just about making jobs faster. It is about helping Spark do less unnecessary work. For data engineers, Spark developers, and professionals preparing for Databricks interviews, these concepts are worth understanding because they affect not only performance but also cloud costs, scalability, and system reliability.
Databricks Optimization Is Not Just About Speed
When engineers hear the word optimization, they naturally think about faster execution times. However, in cloud-based platforms such as Databricks, optimization has another important benefit: cost control. Every minute a cluster remains active consumes compute resources. A poorly optimized workload may require larger clusters, longer execution times, and higher operational costs. Imagine a daily pipeline that runs for two hours on an eight-node cluster. If optimization reduces execution time to forty-five minutes, the organization does not simply receive faster reports. It may also reduce its monthly infrastructure spending significantly. This is one reason performance tuning discussions often involve architects, engineering managers, and platform teams. Good optimization improves user experience while helping organizations use cloud resources more efficiently.
In practice, the best optimization techniques usually improve both speed and cost at the same time.
Before We Discuss Optimization
Many engineers assume that performance problems can be solved simply by increasing cluster size. Sometimes that works, but often it only hides the underlying issue. Imagine two people moving books between rooms. One person carries ten books at a time, while the other carries only one. Giving the second person more strength may help slightly, but the real problem is the process itself. Databricks works in a similar way. If Spark is reading unnecessary data, performing expensive shuffles, or managing thousands of tiny files, adding more compute power may improve results temporarily without addressing the root cause.
The goal of optimization is therefore not to make Spark work harder. It is to reduce unnecessary work so that Spark can spend its resources on useful processing rather than avoidable overhead.
1. Choose the Right File Format
One of the easiest ways to improve performance is to choose the correct storage format. Many organizations receive data as CSV or JSON files. These formats are convenient for data exchange, but they are not ideal for analytical workloads. Consider a dataset containing one hundred columns. If a query requires only five columns, a CSV file still forces Spark to read the entire dataset because CSV is row-oriented. Columnar formats such as Parquet behave differently. Spark can read only the required columns rather than the entire file. This reduces I/O operations, memory usage, and overall processing time. Databricks environments commonly use Delta Lake, which builds on Parquet while adding features such as ACID transactions, schema enforcement, and advanced optimization capabilities.
For most analytical workloads, Parquet and Delta Lake are significantly more efficient than CSV.
2. Partition Data Correctly
Partitioning is one of the most important concepts in Databricks optimization, but it is also one of the easiest to misuse. A good partitioning strategy helps Spark avoid reading unnecessary data. Instead of scanning an entire dataset, Spark can focus only on the partitions relevant to a query. Imagine a retail company storing sales transactions. Most reports filter data by transaction date. In this situation, partitioning by date allows Spark to read only the required partitions rather than the entire dataset. However, more partitions do not automatically mean better performance. A common mistake is partitioning by a high-cardinality column such as TransactionID, CustomerID, or OrderID. Since these columns can contain millions of unique values, Spark may end up creating a huge number of tiny partitions. In such cases, Spark spends more time managing metadata and partitions than processing actual data. Good partitioning reduces unnecessary reads. Poor partitioning creates unnecessary work. The challenge is finding the balance between too few partitions and too many.
3. Avoid the Small Files Problem
One of the most common performance issues in Databricks has nothing to do with SQL queries or cluster size. It starts with how data is stored. Consider two datasets that each contain 10 GB of information.
The first dataset is stored in ten files of roughly 1 GB each. The second dataset is stored in ten thousand files of approximately 1 MB each. Although both datasets contain exactly the same amount of information, Spark must work much harder in the second scenario. Before processing begins, Spark has to discover files, read metadata, schedule tasks, and coordinate execution across thousands of individual objects. This overhead grows rapidly as file counts increase. Industry teams commonly encounter this problem after months of continuous ingestion, where thousands of tiny files gradually accumulate inside data lakes. Over time, job runtimes increase even though the total amount of data has not changed significantly. This is one reason Delta Lake provides features such as OPTIMIZE and Auto Compaction. These capabilities merge small files into larger and more efficient units, allowing Spark to spend less time managing metadata and more time processing data. You can also read our post on “How Databricks Processes a 10GB File?”
As a general rule, Spark performs better with a reasonable number of properly sized files than with thousands of tiny ones.
4. Understand Data Skew
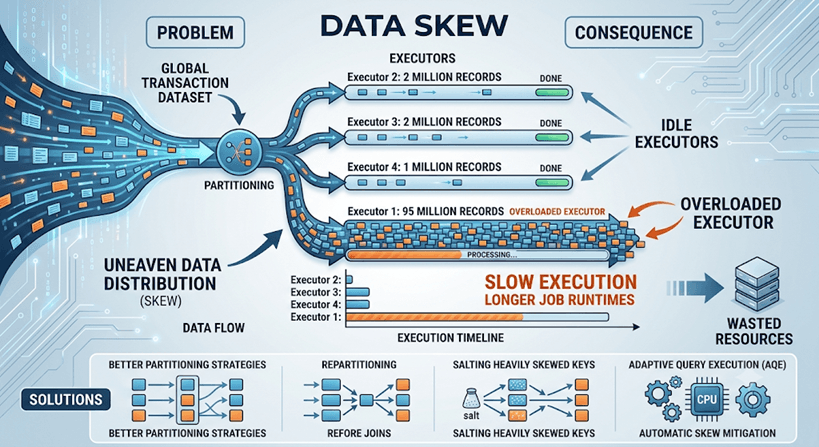
Data skew is one of the most common reasons distributed workloads perform poorly. Skew occurs when data is distributed unevenly across partitions. Imagine a global transaction dataset where 95% of records belong to one country while the remaining 5% are spread across several others. When Spark partitions this data, one executor may receive most of the workload while others remain relatively idle.
For example:
- Executor 1: 95 million records
- Executor 2: 2 million records
- Executor 3: 2 million records
- Executor 4: 1 million records
Even if three executors finish quickly, Spark must still wait for the overloaded executor to complete its work. The result is slower execution, wasted resources, and longer job runtimes. Fortunately, data skew can often be reduced through better partitioning strategies, repartitioning before large joins, or techniques such as salting heavily skewed keys. Modern Spark environments can also use Adaptive Query Execution (AQE) to automatically address certain skew-related situations during runtime.
Understanding skew is important because many performance problems that appear to be infrastructure issues are actually data distribution issues.
5. Use Predicate Pushdown Whenever Possible
Predicate pushdown sounds complicated, but the concept is straightforward. Instead of reading all available data and filtering later, Spark attempts to push filtering closer to the storage layer.
Consider the following query:
SELECT *
FROM sales
WHERE year = 2025
Without optimization, Spark may read the entire dataset before applying the filter. With predicate pushdown, Spark can often identify and read only the relevant data. The result is less I/O, lower memory consumption, and faster execution.
This optimization is particularly effective when working with Parquet and Delta Lake datasets.
6. Cache Data Only When It Makes Sense
Caching can improve performance, but it is frequently misused. Many beginners discover caching and immediately apply it everywhere. Unfortunately, caching every dataset can create more problems than it solves. Caching is most useful when the same dataset is reused multiple times during a workflow. If several transformations repeatedly reference the same intermediate result, caching can prevent Spark from recomputing that data. However, caching large datasets that are only used once wastes valuable memory resources. Before caching a dataset, ask a simple question:
“Will this data be reused enough times to justify occupying cluster memory?”
If the answer is no, caching may not provide any meaningful benefit.
7. Use Broadcast Joins for Small Tables
Joins are among the most expensive operations in distributed computing. Imagine joining a transactions table containing hundreds of millions of records with a customer table containing only a few thousand rows. Without optimization, Spark may move large amounts of data across the network. Broadcast joins solve this problem by sending the smaller table to every executor. Each executor then performs the join locally rather than transferring large datasets between nodes. This reduces network traffic and often produces dramatic performance improvements.
Broadcast joins are one of the simplest and most effective optimization techniques available in Spark.
8. Adaptive Query Execution (AQE)
One of the most important improvements introduced in modern Spark environments is Adaptive Query Execution, commonly known as AQE. Historically, Spark generated an execution plan before a job started and followed that plan throughout execution. The challenge is that initial estimates are not always accurate. Real-world data distributions often differ from assumptions made during planning. AQE allows Spark to adjust execution strategies while a job is running.
Among other capabilities, AQE can:
- Optimize shuffle partitions
- Improve join strategies
- Mitigate certain skew-related issues
- Reduce unnecessary processing overhead
Rather than relying entirely on pre-execution estimates, Spark can make decisions based on actual runtime statistics.
For professionals preparing for Spark or Databricks interviews, AQE is an important concept because it represents how modern Spark workloads optimize themselves dynamically.
9. Optimize Join Strategies
Joins are responsible for some of the most expensive operations in distributed computing environments. Whenever Spark joins large datasets, it may need to move data across executors, redistribute partitions, sort records, and perform shuffle operations. All of these activities consume time, memory, and network resources. Consider a transaction table containing 500 million rows and a reference table containing only a few thousand records. Without optimization, Spark may shuffle large amounts of data across the cluster to complete the join. However, if the smaller table is suitable for broadcasting, Spark can send a copy of that table directly to each executor and perform the join locally.
This significantly reduces network movement and often produces major performance improvements.
When evaluating joins, it is useful to ask a few practical questions:
- Can a small table be broadcast?
- Are join keys distributed evenly?
- Is unnecessary data being joined?
- Can filtering happen before the join?
In many real-world workloads, improving a single inefficient join has produced larger gains than increasing cluster size or adding more hardware.
10. Learn to Read the Spark UI
Many engineers troubleshoot performance problems by repeatedly modifying cluster configurations. A more effective approach is to inspect what Spark is already telling you. The Spark UI provides detailed visibility into workload execution. In Databricks, you can access the Spark UI by opening a running or completed job, selecting the cluster used for execution, and navigating to the Spark UI tab.
Within the Spark UI, pay attention to:
- Long-running stages
- Uneven task durations
- Large shuffle operations
- Memory pressure
- Skewed partitions
Over time, the Spark UI becomes one of the most valuable diagnostic tools available to a data engineer. Many experienced professionals spend more time analyzing Spark UI metrics than changing cluster configurations because the UI often reveals the true source of performance problems.
When Optimization Does Not Help
A balanced discussion about optimization must acknowledge an important reality. Not every performance problem originates within Spark. Sometimes the bottleneck exists elsewhere.
Common examples include:
- Slow source systems
- Network latency
- Storage performance limitations
- Under-sized infrastructure
- External API dependencies
In these situations, additional Spark tuning may produce little benefit. Performance tuning should always begin with observation and measurement rather than assumptions.
Before You Scale Your Cluster
When a Databricks workload runs slowly, the first reaction is often to increase cluster size. Sometimes that is the correct decision. However, experienced engineers usually investigate the workload itself before requesting additional resources.
A useful checklist is:
- Am I reading more data than necessary?
- Are my files too small?
- Is data skew creating bottlenecks?
- Can a broadcast join reduce data movement?
- Is Spark shuffling more data than required?
- Have I checked the Spark UI?
Many performance problems can be solved without adding a single worker node. The most effective Databricks practitioners are not necessarily the ones running the largest clusters. They are the ones who understand where unnecessary work is happening and how to eliminate it.
Optimization is ultimately about efficiency. The less unnecessary work Spark performs, the faster and more cost-effective your platform becomes.